05 Bonus
< Back to 04 Programming Run-time Administration
We might not have time during the main hands-on activity session to do these tasks, but if we do have time, they might be fun extra activities to try out. You can do any of these, in any order.
- 19. Compare performance of a SAS program between small, medium and large compute contexts
- 20. Modify the SAS Studio configuration
- 21. View compute server logs in kubectl logs, OpenLens and OpenSearch Dashboards
- 22. Change the log level for an application or component, e.g. the SAS Viya Identities service
19. Compare performance of a SAS program between small, medium and large compute contexts
-
Sign out of SAS Environment manager (you were signed in as sasadm). Sign in again as username Frank password Student1
Note: Frank is the only user we put in the project Power Users group, and thus the only user at the moment who can use all three compute contexts.
-
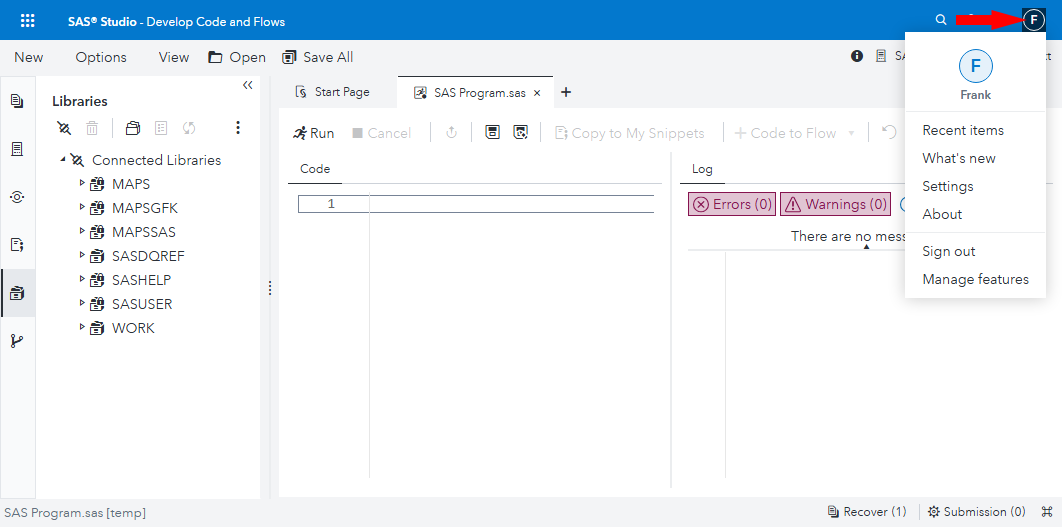
Switch to SAS Studio (‘Develop Code and Flows’). Click the user menu button (which looks like an ‘F’ in a circle) in the SAS Studio header, to confirm you are signed in as Frank:
-
When your compute session has started, switch the compute context to “SAS Studio compute context for [Project] - extra small”, e.g. SAS Studio compute context for FANS - extra small.
Click Change when prompted to ask if you want to change the compute context.
Create test data
-
Copy this SAS code, and paste it into a new SAS Program window. Edit the value of the project macro variable to be your chosen project name, in lowercase.
*************************; * Primes data preparation; *************************; %let project = fans; libname input "/gelcontent/&project./input"; libname prep "/gelcontent/&project./prepared"; libname output "/gelcontent/&project./output"; proc iml; start sieve(n); a = J(n,1); a[1] = 0; do i = 1 to n; if a[i] then do; if i*i>n then return(a); a[i*(i:int(n/i))] = 0; end; end; finish; a = loc(sieve(100000000))`; create work.primes from a; append from a; close work.primes; quit; /* Create a primes dataset in the project prepared data library, containing two copies of the work.primes dataset, with some added columns - the prime number expressed in words, and a random number. The idea is simply to create some fairly large data which we can sort later. */ data prep.primes; set work.primes work.primes; number_in_words=put(col1,words100.); random_number=ranuni(0); run; * See how big the dataset is.; %let libraryname=prep; %let datasetname=primes; PROC SQL ; TITLE ‘Filesize for &libraryname..&datasetname. Data Set’ ; SELECT libname, memname, memtype, FILESIZE FORMAT=SIZEKMG., FILESIZE FORMAT=SIZEK. FROM DICTIONARY.TABLES WHERE libname = upper("&libraryname") AND memname CONTAINS upper("&datasetname") AND memtype = "DATA" ; QUIT; -
Run the program.
When it has finished creating our testing dataset, prep.primes, you should see some results output like this:
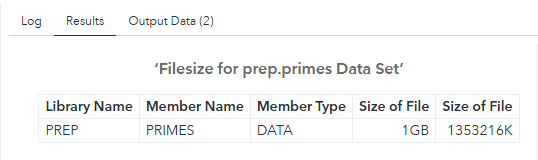
If you select the Output Data tab in SAS Studio, and the primes table in the PREP library, you can see a sample if the table’s data:
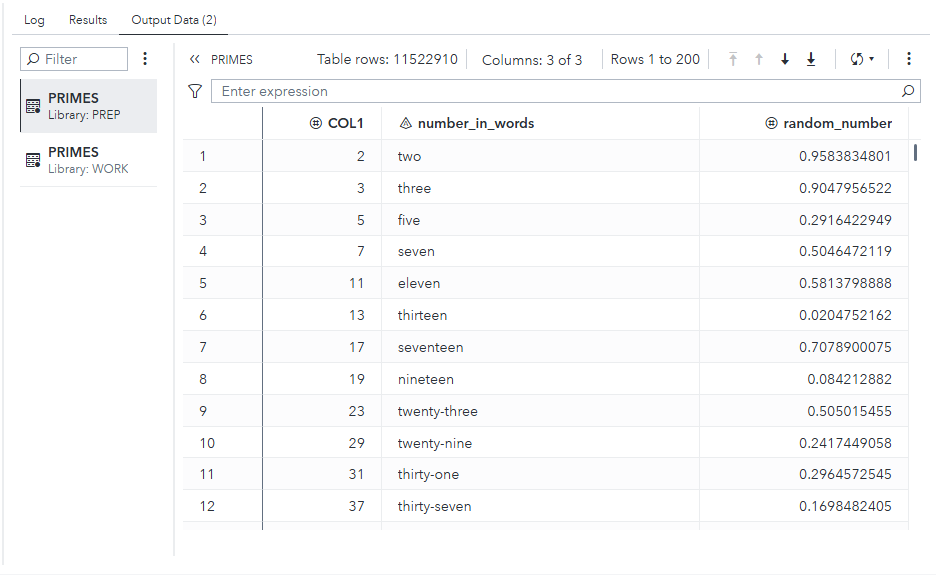
It is nonsense, but it will serve a useful purpose for the stress tests we will run next.
Measure PROC MEANS speed with test data in each compute context
-
To make a fair comparison between this test run and subsequent ones, choose Options > Reset SAS Session to terminate your compute session and its pod, and start a new compute session in a fresh compute server pod:
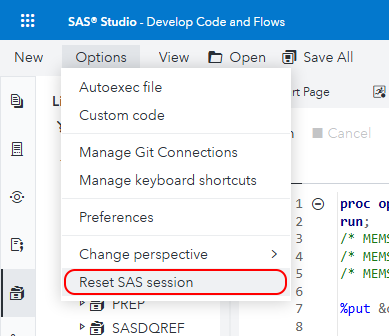
Click Reset when prompted.
-
Wait a moment until the new SAS session is ready. Check that it is running under the “SAS Studio compute context for [Project] - extra small” compute context, e.g. SAS Studio compute context for FANS - extra small.
-
Copy this SAS code, and paste it into another new SAS Program window.
Note: It is designed to require less than 1G memory, and includes a PROC SORT, which is a multi-threaded SAS procedure which can benefit from running more threads on additional CPUs:
proc options option=(memsize cpucount);
run;
/* MEMSIZE=1073741824 is 1G */
/* MEMSIZE=2147483648 is 2G */
/* MEMSIZE=3221225472 is 3G */

%put &context_name;

%let project = fans;
libname prep "/gelcontent/&project./prepared";
libname output "/gelcontent/&project./output";

%let libraryname=prep;
%let datasetname=primes;

*   Load primes dataset into memory;
sasfile &libraryname..&datasetname load;

*   proc means is able to work as a multi-theaded SAS procedure;
proc means data=&libraryname..&datasetname fw=6 n min max median nonobs;
  var random_number;
run;
Extra small compute context with 1 CPU
-
Run the program, in your SAS compute session. It is running under the SAS Studio compute context for FANS - extra small which you selected earlier.
-
When it has finished, select the Log tab in SAS Studio and review the SAS program logs.
The SAS program logs should include these selected lines (N.B. this is not the complete log output):
MEMSIZE=2147483648
CPUCOUNT=1
...
SAS Studio compute context for FANS - extra small
...
NOTE: There were 11522910 observations read from the data set PREP.PRIMES.
NOTE: The PROCEDURE MEANS printed page 1.
NOTE: PROCEDURE MEANS used (Total process time):
      real time           14.78 seconds
      cpu time            14.80 seconds
In our extra-small compute session:
- MEMSIZE is 2G
- CPUCOUNT is 1
- This program took about 14.8 seconds of real time, and about 14.8 seconds of cpu time to calculate its (meaningless) statistics.
- The cpu time and the real time are about the same, implying that PROC MEANS did its work in a single thread.
Note: In the interests of time, just move on to the next test now and test each compute context once as instructed below. However, if you are not in a hurry you might prefer to take a larger sample of real and cpu times for the proc means step for each size of compute context. To get this, you could reset the SAS session again, run the program again, and note the times from the proc means again. Averaging over several sample results should give a more accurate idea of what is happening than using a single result. However, for now you can move on. I’ll show some example results from my testing later in these instructions.
Small compute context with 2 CPUs
-
Click the compute context dropdown menu top right, and change the compute context to your small compute context, e.g. “SAS Studio compute context for FANS - small”.
Click Change when you are prompted.
-
Re-run the same SAS program to run the same proc means statement on the same dataset, and note the lines in the SAS program log:
MEMSIZE=2147483648
CPUCOUNT=2
...
SAS Studio compute context for FANS - small
...
WARNING: A shortage of memory has caused the quantile computations to terminate prematurely for QMETHOD=OS. Consider using
         QMETHOD=P2.
NOTE: The affected statistics will be missing from the corresponding classification levels.
NOTE: There were 11522910 observations read from the data set PREP.PRIMES.
NOTE: The PROCEDURE MEANS printed page 1.
NOTE: PROCEDURE MEANS used (Total process time):
      real time           8.46 seconds
      cpu time            16.04 seconds
In our small-sized compute session:
- MEMSIZE is 2G
- CPUCOUNT is 2
- This program took about 8.5 seconds of real time, and about 16.0 seconds of cpu time to calculate its (meaningless) statistics.
- The cpu time is roughly 1.9 times as big as the real time, implying that PROC MEANS did its work using 2 threads, with a little bit of CPU time spent distributing the work among those threads and collating the results.
- There is a warning about a shortage of memory. I am ignoring it, but it suggests that the design of this test can probably be improved.
Standard compute context with 4 CPUs
-
Click the compute context dropdown menu top right, and change the compute context to your standard project compute context, e.g. “SAS Studio compute context for FANS” (without an ‘ - extra small’, ‘ - small’ or ‘ - large’ suffix).
-
Re-run the same SAS program above, and note the lines in the SAS program log:
MEMSIZE=2147483648
CPUCOUNT=4
...
SAS Studio compute context for FANS
...
WARNING: A shortage of memory has caused the quantile computations to terminate prematurely for QMETHOD=OS. Consider using
         QMETHOD=P2.
NOTE: The affected statistics will be missing from the corresponding classification levels.
NOTE: There were 11522910 observations read from the data set PREP.PRIMES.
NOTE: The PROCEDURE MEANS printed page 1.
NOTE: PROCEDURE MEANS used (Total process time):
      real time           5.34 seconds
      cpu time            17.14 seconds
In our standard-sized compute session:
- MEMSIZE is 2G
- CPUCOUNT is 4
- This program took about 5.3 seconds of real time, and about 17.1 seconds of cpu time to calculate its (meaningless) statistics.
- The cpu time is roughly 3.3 times as big as the real time, implying that PROC MEANS did its work using 4 threads, with a little bit more CPU time spent distributing the work among those threads and collating the results with 4 threads than with 2 threads.
- There is still the a warning about a shortage of memory, which I am still ignoring.
Large compute context with 8 CPUs
-
Click the compute context dropdown menu top right, and change the compute context to your large compute context, e.g. “SAS Studio compute context for FANS - large”.
Click Change when you are prompted.
-
Re-run the same SAS program above, and note the lines in the SAS program log:
MEMSIZE=2147483648
CPUCOUNT=8
...
SAS Studio compute context for FANS - large
...
WARNING: A shortage of memory has caused the quantile computations to terminate prematurely for QMETHOD=OS. Consider using
         QMETHOD=P2.
NOTE: The affected statistics will be missing from the corresponding classification levels.
NOTE: There were 11522910 observations read from the data set PREP.PRIMES.
NOTE: The PROCEDURE MEANS printed page 1.
NOTE: PROCEDURE MEANS used (Total process time):
      real time           5.25 seconds
      cpu time            29.70 seconds
In our large-sized compute session:
- MEMSIZE is 2G
- CPUCOUNT is 8
- This program also took about 5.3 seconds of real time, but about 30.0 seconds of cpu time to calculate its (meaningless) statistics. It was not meaningfully faster with 8 CPUs than with 4 CPUs!
- The cpu time is roughly 5.7 times as big as the real time, implying that PROC MEANS did its work using 8 threads, with a lot bit more CPU time spent distributing the work among those threads and collating the results with 8 threads than with 4 threads. This performance could be described as WORSE than running the same procedure with 4 threads.
- There is still the a warning about a shortage of memory, which I am still ignoring.
Results of three runs in each size of compute context
I ran each test three times and recorded the results. Here is what I observed, tabulated in Excel:
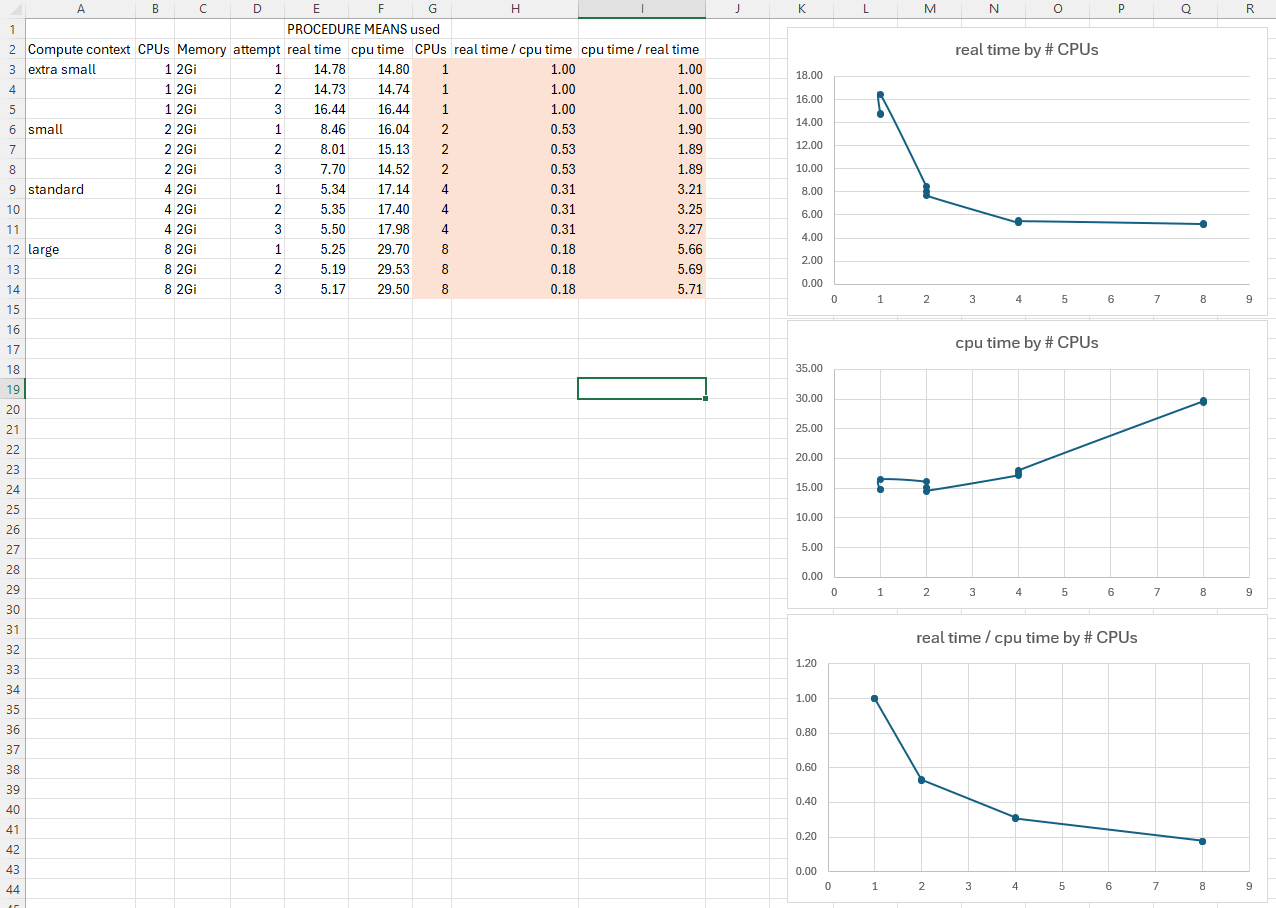
We could have an interesting discussion about what these results mean, but our main point is that the changes you made to the compute and launcher contexts have been effective and produced different results. You now know how to create SAS Viya launcher and compute contexts with varying properties. Let’s move on.
20. Modify the SAS Studio configuration
There are lots of configuration settings for SAS Studio that you can change to suit your requirements and preferences. Let’s change one of these, programmatically.
-
Switch to SAS Studio (‘Develop Code and Flows’)
-
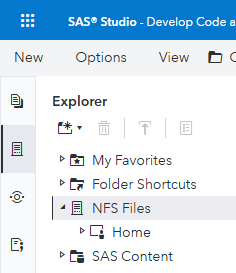
Select the Explorer tab on the left, and expand NFS Files.
You should just see the current user’s Home directory.
-
Run this to create a JSON file which, when applied, will change the SAS Studio fileNavigatioRoot property to CUSTOM, and set the fileNavigationCustomRootPath property to the
/gelcontentdirectory:MEDIATYPE=$(sas-viya configuration configurations download -d sas.studio | jq -r '.items[]["metadata"]["mediaType"] ' ) echo ${MEDIATYPE} tee /tmp/update_studio.json > /dev/null << EOF { "name": "configurations", "items": [ { "metadata": { "isDefault": false, "mediaType": "${MEDIATYPE}" }, "fileNavigationRoot": "CUSTOM", "fileNavigationCustomRootPath": "/gelcontent" } ] } EOF -
Then apply that configuration file:
sas-viya configuration configurations update --file /tmp/update_studio.jsonExpected output:
"PATCH" "/configuration/configurations" complete from "/tmp/update_studio.json". -
Switch to SAS Studio, sign out, and sign in as sasadm again.
-
Select the Explorer tab on the left, and expand NFS Files.
-
Now, in the Explorer tab, if you expand NFS Files > Files, you should see the content of the directory that is /workshop/gelcontent on the server, and is mounted into the SAS Programming Run-time pods as /gelcontent. It looks like this:
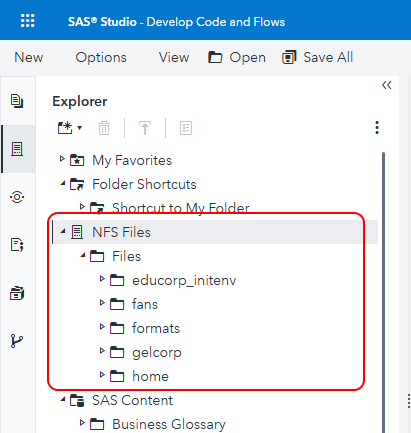
This includes the new project directory that we created in this hands-on activity, called fans in the screenshot above. If you expand it, you should see some files and directories you recognize from this activity.
-
You can also view the same directories under /gelcontent from the command line, inside the compute server pod.
kubectl exec -it \
  $(kubectl get pod \
      -l launcher.sas.com/requested-by-client=sas.studio,launcher.sas.com/username=sasadm \
      --output=jsonpath={.items..metadata.name}) \
      -c "sas-programming-environment" \
      -- bash \
      -c "ls -al /gelcontent"
Expected output:
total 28
drwxrwxrwx+ 7 sas  2003 4096 Nov 12 16:31 .
drwxr-xr-x  1 root root 4096 Nov 14 17:58 ..
drwxrwxrwx  9 1004 1004 4096 Nov  4 10:25 educorp_initenv
drwxrwxrwx+ 5 1004 1004 4096 Nov 14 17:47 fans
drwxrwxrwx+ 2 root root 4096 Nov 13 11:37 formats
drwxrwsrwx+ 7 sas  2003 4096 Mar 22  2020 gelcorp
drwxr-xr-x+ 2 root root 4096 Oct  7  2020 home
The directory list in SAS Studio and from an
lscommand run insode the compute server pod should look similar.
21. View compute server logs in kubectl logs, OpenLens and OpenSearch Dashboards
Run SAS program with distinctive line of code.
-
Navigate to SAS Studio (‘Develop Code and Flows’), and make sure you are signed in as sasadm.
-
Run this line of SAS code in a new SAS Program window:
%put "Quizdeltagerne spiste jordbær med fløde, mens cirkusklovnen Walther spillede på xylofon." * Source: https://da.wikipedia.org/wiki/Pangram;
Find that line of code in logs.
-
In Remote Desktop Manager, find the name of the sas-compute-server pod which is running that sasadm compute session, and store it in an environment variable:
# Find the name of the sas-compute-server pod which is running that sasadm compute session pod=$(kubectl get pod \ -l launcher.sas.com/requested-by-client=sas.studio,launcher.sas.com/username=sasadm \ --output=jsonpath={.items..metadata.name}) echo "Pod name is: ${pod}" -
List the pod logs from the sas-programming-environment container in that pod, and search them for a distinctive keyword:
kubectl logs ${pod} -c "sas-programming-environment" | grep "Quizdeltagerne"Expected result - SAS structured logs are a JSON format:
{"level":"info","message":"80 %put \"Quizdeltagerne spiste jordbær med fløde, mens cirkusklovnen Walther spillede på xylofon.\" * Source:","properties":{"caller":"ynl4sas.c:137","logger":"App.Program","pod":"sas-compute-server-a1369145-82cb-4f56-8bd8-630bb9ee603a-92","thread":"00000006"},"source":"compsrv","timeStamp":"2025-11-03T11:42:12.751000+00:00","version":1} {"level":"info","message":"\"Quizdeltagerne spiste jordbær med fløde, mens cirkusklovnen Walther spillede på xylofon.\" * Source: ","properties":{"caller":"ynl4sas.c:137","logger":"App.Program","pod":"sas-compute-server-a1369145-82cb-4f56-8bd8-630bb9ee603a-92","thread":"00000006"},"source":"compsrv","timeStamp":"2025-11-03T11:42:12.751000+00:00","version":1} -
Or alternatively, using jq we can reformat SAS structured logs to make them more easily human readable, for example like this:
kubectl logs ${pod} -c "sas-programming-environment" | grep "Quizdeltagerne" | jq -R -r '. as $line | try (fromjson| "\(.level | ascii_upcase) \(.timeStamp) '['\(.source)']-' \(.message) " ) catch $line 'Expected result:
INFO 2025-11-03T11:42:12.751000+00:00 [compsrv]- 80 %put "Quizdeltagerne spiste jordbær med fløde, mens cirkusklovnen Walther spillede på xylofon." * Source: INFO 2025-11-03T11:42:12.751000+00:00 [compsrv]- "Quizdeltagerne spiste jordbær med fløde, mens cirkusklovnen Walther spillede på xylofon." * Source: -
If you view logs this way often, it might be worth defining a function to format structured SAS logs the way you would like them to be formatted:
# Define function - this could be in a file included in your .bashrc or equivalent: tee /workshop/gelcontent/gel_log_functions.shinc > /dev/null << EOF #!/bin/bash # two functions that simulate klog function gel_log_verbose () { jq -R -r '. as \$line | try (fromjson| "\(.level | ascii_upcase) \(.timeStamp) '['\(.source)']-' \(.message) \(.messageParameters) " ) catch \$line ' } function gel_log () { jq -R -r '. as \$line | try (fromjson| "\(.level | ascii_upcase) \(.timeStamp) '['\(.source)']-' \(.message) " ) catch \$line ' } EOF # You could a line like this to your .bashrc, so that these functions are always defined for the current user # If you just run it interactively the functions will be defined source /workshop/gelcontent/gel_log_functions.shinc -
Then just append gel_log to any output from kubectl logs to try formatting it with one of those functions: kubectl logs ${pod} -c "sas-programming-environment" | grep "Quizdeltagerne" | gel_log kubectl logs ${pod} -c "sas-programming-environment" | grep "Quizdeltagerne" | gel_log_verbose -
If you don’t already have the “SAS Viya Links” / Links to Applications page (SASViyaLinks.html) open, double-click the desktop shortcut to open it now:

-
In the “SAS Viya Links” / Links to Applications page, click the link for OpenSearch Dashboards near the bottom.
-
Sign in to OpenSearch Dashboards as user admin, password Student1.
-
When prompted to Select your tennant, just click Confirm.
Note: There is only one option you can choose, and it is already selected.
-
When the popup introducing new OpenSearch Dashboards look & feel appears, click Dismiss.
-
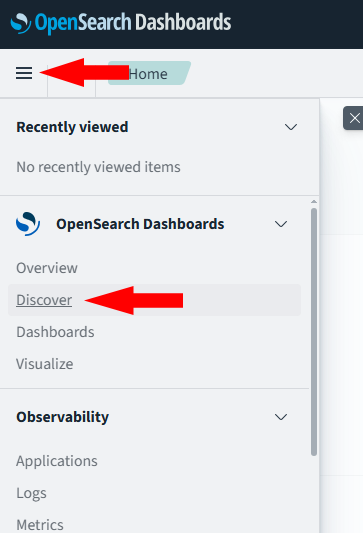
Click the application menu button top left, and choose Discover:
-
Then click Open > Log Messages from the menu bar top right, to open the Log Messages saved search.
Note: This saved search has three columns in the main table in addition to the Time column which is always there and always on the left of the table: level, logsource and message.
-
In the Search texbox at the top, type “Quizdeltagerne” and press Enter or click the Refresh button:
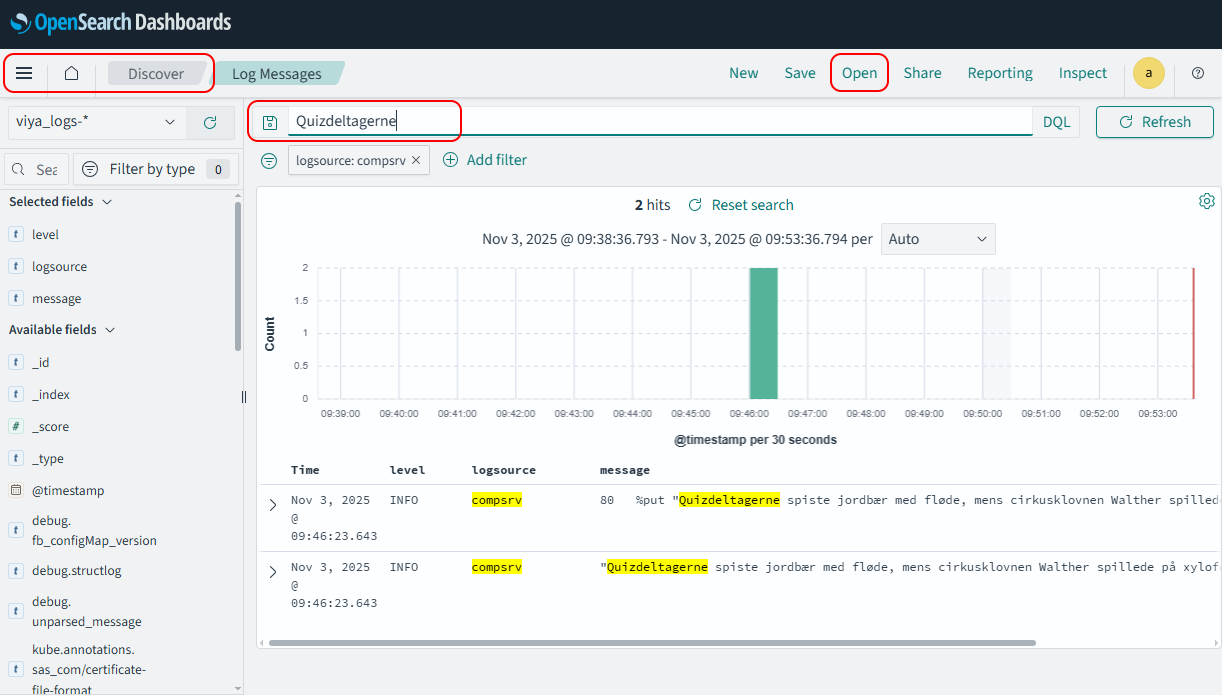
Notice that you found the same messages without having to tell it which pod the messages were in.
- Try expanding a log document by clicking on the ‘>’ button next to the timestamp. Notice the amount of contextual information available here is much more than was easily accessible with the kubectl logs commands and jq filters we looked at earlier in this task.
Good enterprise-scale log monitoring tools have great search and filtering features, which we do not have much time to explore today.
22. Change the log level for an application or component, e.g. the SAS Viya Identities service
Watch my video here: https://www.youtube.com/watch?v=pGMj23QCA_c to learn more about how changing log levels can help find log messages that are not otherwise available in a realistic troubleshooting scenario.
The code featured in the video is here: https://communities.sas.com/t5/SAS-Communities-Library/Code-for-YouTube-video-quot-Viewing-Logs-with-SAS-Viya/ta-p/805096
It explains how to troubleshoot an issue with the identities service. First, we see that the problem lies in the SAS Viya Identities service, and look for log messages from the Identities service that would help us understand what is not working correctly. However, we find that by default the log messages from this service do not contain enough detail to see what is happening.
Then, the video shows how to change the log level for the identities service from the default INFO to TRACE, by creating a new logging.level configuration instance for the identities service in the Configuration page in SAS Environment Manager.
Then, we see that TRACE level log messages are now being created, and use them to see the root cause of our problem. We fix the problem.
-
We also see how to create the logging.level configuration instance which sets the logging level for the SAS Viya Identities service to TRACE, using code like this:
tee /tmp/identities.logging.level.trace.json > /dev/null << EOF
{
    "version": 2,
    "accept": "application/vnd.sas.configuration.config+json",
    "count": 1,
    "name": "configurations",
    "items": [
        {
            "metadata": {
                "isDefault": false,
                "mediaType": "application/vnd.sas.configuration.config.logging.level+json;version=1",
                "services": [
                    "identities"
                ]
            },
            "version": 1,
            "level": "TRACE",
            "name": "com.sas.identities"
        }
    ]
}
EOF

sas-viya configuration configurations create --file /tmp/identities.logging.level.trace.json
Expected output:
"POST" "/configuration/configurations" complete from "/tmp/identities.logging.level.trace.json". -
To finish up, we need to return the logging level for the identities service to its default level, INFO. You can do this in SAS Environment Manager, and you can also delete the configuration instance we just created BUT you have to use the sas-viya command-line interface to delete the configuration instance. There is no button to do it in SAS Environment Manager. We see how to delete the logging.level configuriotn instance, using code like this:
sas-viya --output text configuration configurations delete \
  --id $(sas-viya --output text configuration configurations list \
           | grep identities \
           | grep logging.level \
           | awk '{print $1}')
Expected output (the configuration instance ID will differ between environments):
The deletion of configuration "4cac3ef5-cc72-46d8-a632-19b0b6391a5c" is complete.Do not forget to do this to ‘turn off’ TRACE level logging, and avoid generating a large volume of log messages that need to be stored, when you do not need them.